De-risk your pipeline. Drive growth.
As a leader you need to know which moves will drive growth and which carry risk: which buyers to pursue, how to approach them, where teaming gives you an edge, and how exposed your own pipeline is. TenderMetro puts pipeline health, market movement and competitive position on one live screen across every market you work in — so you can allocate resources wisely and lead with confidence, instead of waiting for someone to build the deck.
Why teams come to us
The situation
Leadership reporting is assembled by hand each month, arrives late, and rarely agrees with what the capture team believes.
What changes with TenderMetro
- One source of truth for pipeline and win rate
- Market decisions made on live volumes, not last year's report
- Monthly reporting time cut to minutes
Where the data comes from
Official sources only: national and municipal portals, EU TED, SAM.gov, UN agencies and development banks — each refreshed on its own schedule, deduplicated, and kept with the reference it was published under.
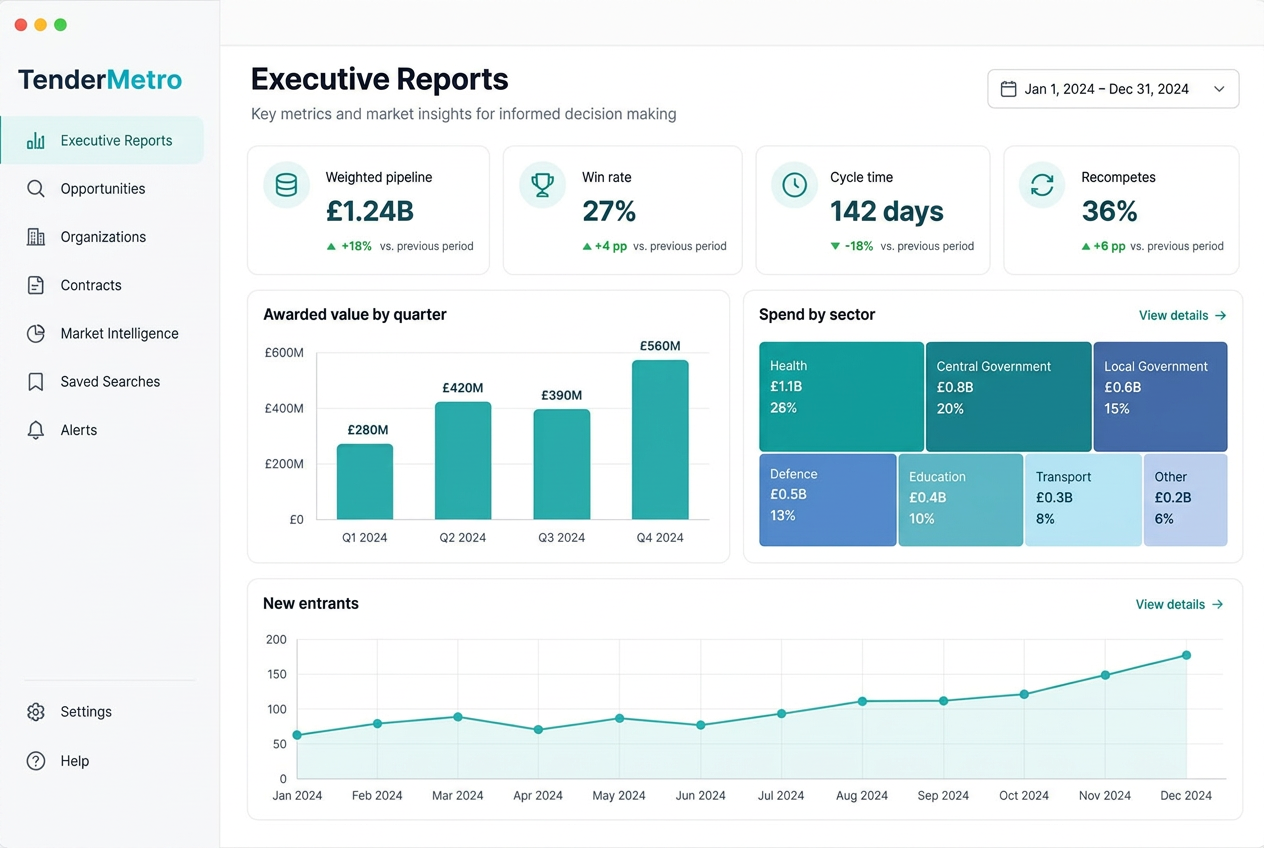
See how records are structured →Awarded value by quarter
Live from the TenderMetro index.
Workflow
How it works
- 01
Connect the pipeline
Pursuits worked by the team roll straight into weighted value, win rate and cycle-time metrics.
- 02
Watch the market
Tender and award volumes by sector, region and buyer show where demand is actually moving.
- 03
Forecast on signals
Expiring contracts and recompete windows give a forward view instead of a backward one.
- 04
Report in one click
Export the numbers behind every chart for board packs and investor updates.
Capabilities
What you get
Everything below is included on every plan, worldwide.
Command deck
Win confidence, weighted pipeline, capture funnel and deadline runway on one screen.
Market analytics
Volumes and values by sector, region, buyer and quarter across the whole index.
Coverage view
Which of your target markets you are actually bidding in, and where you are absent.
Recompete forecast
Contracts expiring in the next four quarters, by buyer and category.
Team performance
Win rate and cycle time by owner, pipeline and sector.
Board-ready exports
Every figure exportable, so the numbers in the deck trace back to records.
Proof
What teams tell us
It is the first time our whole team is working from the same view of the market — the tenders, who won the last one, and what it went for.
FAQ
Questions teams ask
Who can see the dashboards?
Everyone in your workspace sees shared pipelines; administration and platform-wide views are limited to workspace admins.
Can we feed our BI tool?
Yes. The REST API and CSV exports carry the same records the dashboards are built on.
How current are the figures?
Pipeline metrics update as the team works; market figures update on each source refresh.
Keep exploring
Keep exploring TenderMetro.
TenderMetro makes your everyday work — less work.
Opportunity Identification
One search across government, public and private tender sources worldwide — with alerts that reach you while there is still time to bid.
Learn more →Capture Management
Run every pursuit from first signal to submitted bid in one pipeline built for capture teams, not a generic sales CRM.
Learn more →Competitive Intelligence
Know who is winning, where, and at what price — with award history attached to every buyer, supplier and category.
Learn more →Teaming & Partner Identification
Find the right partners, distributors and subcontractors for any pursuit — chosen on real award history rather than a directory listing.
Learn more →Proposal Management
Move from a capture decision to a compliant proposal with the requirements already extracted and the team working from one list.
Learn more →Go-to-Market Strategy
Build a go-to-market plan on counted demand instead of anecdote. Size any category and country by tender volume and awarded value, identify the buyers and decision-makers who matter, track competitor and incumbent activity, and align marketing and business development around the same intelligence — then put saved searches in place so the new market starts feeding your team from day one.
Learn more →Put strategic leadership to work
Start a 14-day trial with global coverage on every plan, or ask us to walk you through your own markets.